Modern infrastructure is dynamic. Containers and services start and stop frequently, and monitoring configurations must adapt. Usually, services expose metrics using the Prometheus exposition format at a /metrics endpoint. At the same time, organizations often standardize on observability backends that accept only OpenTelemetry Protocol(OTLP).
This creates a common integration problem:
- Applications already expose Prometheus metrics.
- Re-instrumenting services introduces operational risk.
- Telemetry must still be exported using OTLP.
This guide shows how to solve this problem using a single pipeline. You will:
- Expose a Prometheus native histogram from a Go service.
- Collect it using the OpenTelemetry Collector.
- Convert it into the OpenTelemetry metric model.
- Export it to an OTLP-only backend without modifying application instrumentation.

The example used throughout this guide is a checkout service that exposes request latency metrics.
Prerequisites
Before implementing this pipeline, ensure the following components are available:
- Prometheus Server or Agent: Version 3.8 or later, which provides stable support for native histograms.
- Instrumentation: Applications instrumented using a client library that supports native histograms, such as the Prometheus Go client (v1.14 or later).
- OTLP backend : A backend capable of ingesting OpenTelemetry exponential histograms, for example Grafana Mimir, Honeycomb, or another OpenTelemetry Collector.
Why use native histograms
Classic histograms rely on predefined bucket boundaries and expose multiple time series for a single metric. This increases cardinality and can lead to higher storage and processing costs.
Native histograms dynamically adjust bucket boundaries based on observed data. This allows higher precision latency analysis while reducing storage overhead. Native histograms also align directly with the OpenTelemetry metric model, making them the preferred format when exporting to OTLP backends.
Key advantages include:
- Lossless mapping: Native histograms using standard schemas map directly to OpenTelemetry exponential histograms without losing distribution accuracy.
- Reduced cardinality: A single histogram replaces multiple
_buckettime series. - Improved efficiency: Sparse binary encoding reduces network transfer size and backend storage requirements.
Note: If native histogram scraping is not enabled, Prometheus still discovers and scrapes targets successfully but collects classic histograms instead. When exported to an OTLP backend, this results in lower-resolution latency data.
Architecture Overview
The OpenTelemetry Collector serves as the bridge between Prometheus instrumentation and OTLP-based observability backends. It handles the translation of data models, allowing applications to expose metrics via standard Prometheus endpoints (/metrics) while enabling downstream consumption via OTLP.
The pipeline includes three stages:
- Collection(scrape): The receiver (either the Collector’s internal Prometheus receiver or a standalone Prometheus Agent) scrapes the target.
- Transformation(Mapping): The Collector maps the Prometheus metric data model into the OpenTelemetry metric data model.
- Export(OTLP): The transformed metrics are serialized and transmitted to the backend via OTLP.
The Collector performs a data model conversion. It does not aggregate data or recompute histogram values. Bucket boundaries, counts, sum, and count remain unchanged.

Collect Metrics in Dynamic Environments
Prometheus uses a pull-based model where the scraper connects to targets to retrieve metrics. This design separates:
- Target discovery, which determines where metrics exist.
- Metric ingestion, which retrieves data from those targets.
This separation allows infrastructure to change without updating monitoring configuration.
The checkout-service exposes: http://checkout:8080/metrics
Note: In static configurations, scrape targets are defined explicitly. This approach works in stable environments but fails in containerized systems where IP addresses change frequently. Hence, Dynamic environments require automated service and target discovery.
Scrape Prometheus Metrics with the OpenTelemetry Collector
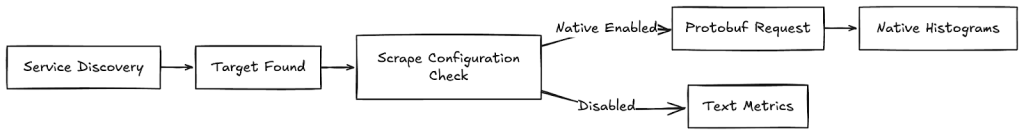
The OpenTelemetry Collector uses the Prometheus receiver to scrape metrics from targets that expose a /metrics endpoint. To collect native histograms, the receiver must negotiate the Protobuf exposition format during scraping.
Native histograms cannot be collected using the standard text-based format. The scraper must explicitly request binary exposition.
For example, the following configuration enables native histogram collection from the checkout service:
receivers: prometheus: config: scrape_configs: - job_name: checkout scrape_interval: 15s static_configs: - targets: ["checkout:8080"] # Enables Protobuf negotiation required for native histograms scrape_native_histograms: true # Optional: limits bucket growth to protect memory usage native_histogram_bucket_limit: 100This configuration instructs the Collector to scrape the checkout service every 15 seconds and request native histogram data when available.
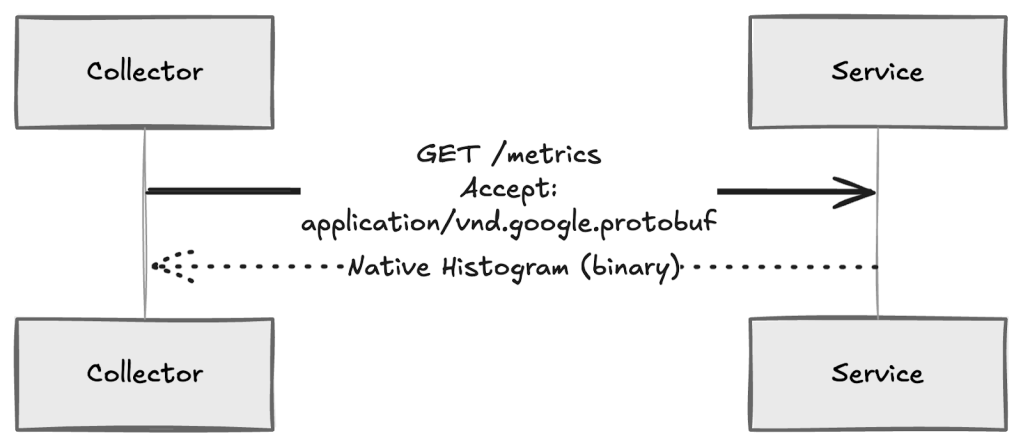
During each scrape:
- The receiver sends an HTTP request with an Accept header that prefers
application/vnd.google.protobuf. - If the target supports Protobuf exposition, it returns native histograms.
- The receiver ingests the response as structured histogram samples instead of multiple
_buckettime series.
Transform Prometheus Histograms into OTLP Metrics
Transformation occurs immediately after collection. The OpenTelemetry Collector converts the Prometheus histogram into an OpenTelemetry exponential histogram. The checkout service only exposes metrics. Parsing and conversion occur entirely inside the Collector.

Step 1: Parse Prometheus native histograms
During scraping, the checkout service returns the latency histogram as a binary Protobuf response. Instead of receiving multiple _bucket time series, the Collector receives a single structured histogram sample.
Example configuration (otel-collector-config.yaml):
receivers: prometheus: config: scrape_configs: - job_name: checkout-service scrape_interval: 15s static_configs: - targets: ["checkout:8080"] scrape_native_histograms: true native_histogram_bucket_limit: 100This configuration instructs the Collector to request native histogram data and limits bucket growth to protect memory usage. For the checkout service, the native histogram sample contains:
- Total number of requests.
- Total accumulated latency.
- Histogram schema defining resolution.
- Sparse buckets representing observed latency ranges.
The service exposes:
http_request_duration_seconds { count: 50 sum: 12.3 schema: exponential buckets: [...]}The Collector decodes this structure directly from the Protobuf response. At this stage:
- The histogram still represents Prometheus data.
- No aggregation or recomputation has occurred.
- The latency distribution remains unchanged from the application output.
Step 2: Convert to OpenTelemetry exponential histograms
After parsing, the Collector converts the histogram into the OpenTelemetry metric model. Because Prometheus native histograms and OpenTelemetry exponential histograms use compatible sparse exponential encoding, this conversion is direct.
The Collector performs the following mappings:
| Prometheus component | OpenTelemetry component | Behavior |
| Schema | Scale | Defines histogram resolution. Prometheus schema n maps directly to OpenTelemetry scale n. |
| Zero bucket | Zero count | Observations near zero are preserved with the same threshold and count. |
| Bucket index | Bucket index | Sparse indices are mapped with a fixed offset (i<sub>prom</sub> → i<sub>otel</sub> − 1). |
Note:
This mapping applies to standard schemas (−4 to +8). Native histograms using custom bucket schemas (schema −53), typically used to replicate legacy bucket boundaries, cannot be converted to OpenTelemetry exponential histograms. In this case, the Collector converts the data to explicit bucket histograms. Values remain correct, but sparse storage efficiency is reduced.
The resulting OpenTelemetry histogram represents the same latency distribution generated by the checkout service:
- Request count remains unchanged.
- Total latency sum remains unchanged.
- Populated latency buckets remain logically equivalent.
Only the internal representation changes to match the OTLP data model.
Apply Production Transformations (Optional)
After metrics are converted into the OpenTelemetry data model, production pipelines typically apply transformations before export. These transformations standardize metadata, reduce storage cost, and improve query consistency without changing metric meaning.
At this stage, the checkout latency metric exists inside the Collector as an OpenTelemetry exponential histogram. Transformations operate only on attributes (labels), not on histogram values.
Common transformation patterns include:
- Normalize metric naming:Standardize naming across services for consistent dashboards and queries.
- Environment-based filtering: Reduce ingestion volume by excluding non-production telemetry.
These transformations do not modify histogram scale, bucket boundaries, or distribution data.
Configuration lifecycle and validation
Apply transformation changes gradually and validate configuration before deployment:
- Validate Prometheus configuration: promtool check config
prometheus.yml. - Validate Collector configuration before restarting the service.
- Use runtime reloads where supported to avoid interrupting metric collection.
These practices reduce the risk of pipeline failures during configuration updates.
Export Metrics to an OTLP Backend
After collection and transformation, the OpenTelemetry Collector exports metrics to the observability backend using OTLP. At this stage, metrics already exist in the OpenTelemetry data model. The export stage is responsible for reliable transport and delivery, not for modifying metric values.
In the checkout-service example, the Collector has already:
- Scraped the latency histogram.
- Converted it into an OpenTelemetry exponential histogram.
- Applied optional metadata transformations.
The exporter sends this histogram to the OTLP backend without changing its distribution or resolution.
OTLP exporter configuration
The OTLP exporter handles batching, authentication, and transmission of metrics.
Example configuration:
exporters: otlp: endpoint: "otlp-backend:4317" tls: insecure: false compression: gzip sending_queue: enabled: true queue_size: 5000service: pipelines: metrics: receivers: [prometheus] processors: [batch] exporters: [otlp]In this configuration:
- Histogram data is batched before export.
- Failed transmissions are retried automatically.
- Histogram structure is serialized without modification.
If custom bucket schemas are used, the Collector converts native histograms into explicit bucket histograms. Values remain correct, but storage efficiency decreases.
Transport protocols
OTLP supports two transport options:
- OTLP/gRPC: Recommended for production environments. Uses Protobuf serialization and efficiently transports binary histogram data.
- OTLP/HTTP: Supported when gRPC is not available. Ensure the backend accepts Protobuf payloads to avoid unnecessary conversion overhead.
Transport choice affects performance and reliability but does not change histogram semantics.
Validate and Troubleshoot
After deploying the pipeline, validate that histogram data remains intact from collection through export. Native histograms use structured binary data, and incorrect configuration can silently downgrade or drop histogram information without producing obvious errors.
For checkout-service example which exposes request latency as a Prometheus native histogram at: http://checkout:8080/metrics is collected as a native histogram, converted into an OpenTelemetry exponential histogram, and exported without losing distribution accuracy.
Validation should confirm that:
- Histogram distribution is preserved.
sumandcountvalues remain consistent.- Histograms appear correctly in the OTLP backend.
Use the following checklist to validate the pipeline end to end.
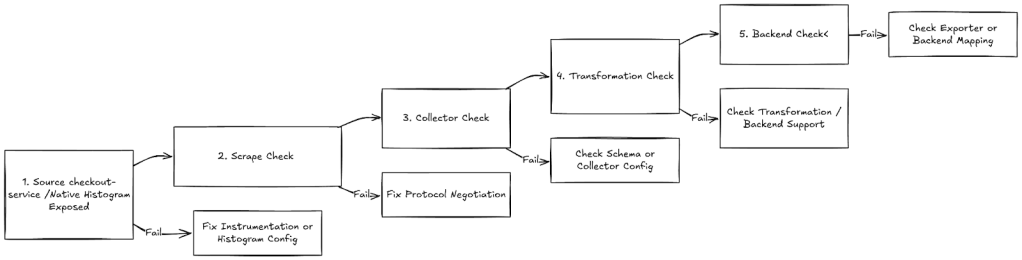
Step 1. Source validation
Verify that the checkout service exposes native histograms correctly.
- Query the metric in the Prometheus UI.
- Expected result: A histogram object with count and sum fields.
- Failure indicator: Multiple
_bucket,_sum,_countseries appear.
Step 2. Scrape validation
Confirm that the scraper negotiated the correct protocol.
Expected response header:
Content-Type: application/vnd.google.protobufIf the response is text/plain, the Collector is ingesting classic histograms instead of native histograms.
Step 3. Collector validation
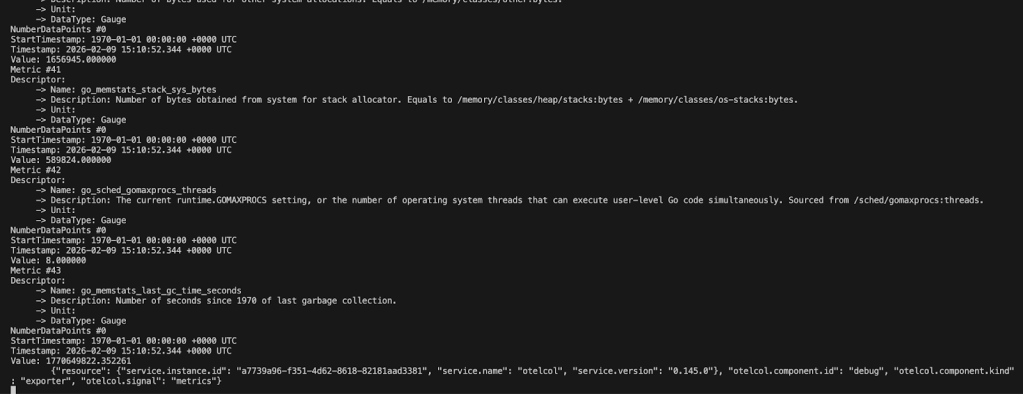
Inspect Collector output using the debug exporter or logs.
- Expected:
- DataType: Histogram
- Data point type: Exponential
- Warning sign:
- Data point type: Explicit
Step 4. Transformation validation
Confirm that transformation did not alter histogram semantics.
Verify:
sumandcountvalues match source metrics.- Bucket distribution appears consistent.
- Histogram scale is supported by the backend.
Step 5. Backend validation
In the OTLP backend:
- Metrics appear as histograms or heatmaps.
- Percentile queries return expected latency values.
- Distribution shape matches application behavior.
If metrics appear as gauges or counters, histogram conversion failed.
6. Pipeline health monitoring
Monitor internal metrics to detect issues early:
upandscrape_duration_secondsfor scrape health- exporter queue length and retry counters
- dropped or pending samples in export metrics
Conclusion
This pipeline allows an SRE to collect Prometheus native histograms from a /metrics endpoint and export them to an OTLP-only backend without changing application instrumentation.
The OpenTelemetry Collector provides a reliable translation layer between Prometheus and OpenTelemetry data models. Histogram semantics remain intact while enabling standardized telemetry export.
For more information, refer to
