OpenTelemetry has become the default standard for generating telemetry in cloud-native systems. It defines how apps create traces, metrics, and logs, and it gives engineering teams a shared language across services and platforms.
Yet many teams discover a frustrating reality after adoption: telemetry exists, but incidents are still hard to understand. Consider a familiar production environment(env):
- Kubernetes-based infrastructure
- Distributed microservices
- OpenTelemetry instrumentation across service
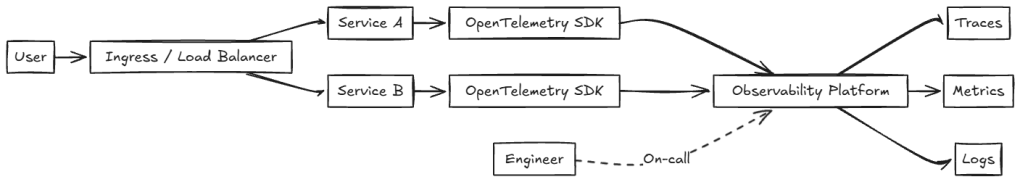
Logs, metrics, and traces flow as expected. Dashboards populate. Alerts fire. Still, incidents remain difficult to diagnose, with questions such as:
- Was this trace dropped?
- Was this metric sampled or aggregated?
This results in:
- Incident resolution slows down
- Engineers lose confidence in observability data
- Platform teams become bottlenecks during on-call
When engineers cannot explain what happened to telemetry after it left the app, observability breaks down. At that point, telemetry becomes noise rather than information.
OpenTelemetry Is the Foundation, Not the Solution
OpenTelemetry solves an important problem, but it does not solve observability on its own. What OpenTelemetry provides:
- Standard APIs and SDKs for instrumentation
- Shared semantic conventions
- OTLP as a vendor-neutral transport
These capabilities standardize how telemetry is produced and transported. They ensure consistency at the source.
What OpenTelemetry does not define:
- Storage semantics
- Query behavior
- Debugging workflows
- Cost and signal trade-offs
OpenTelemetry puts platform teams in control of observability outcomes. How telemetry is processed now depends on the platform. Platforms that hide this behavior behind abstraction often create confusion during incidents.
For example, consider a Minecraft server running on Kubernetes.This setup includes:
- Game server pods
- A proxy or gateway service
- A world persistence service
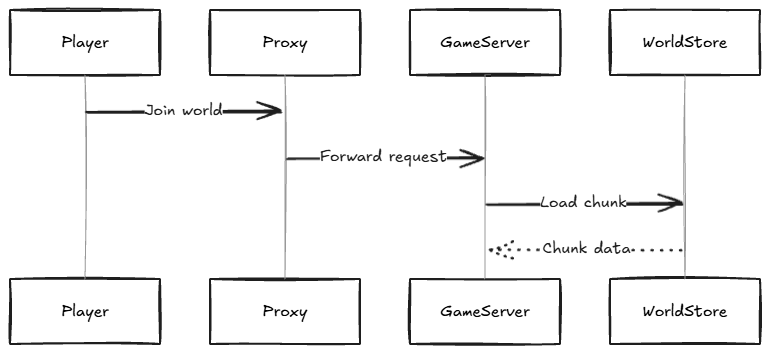
This creates telemetry for:
- Player login requests
- Chunk loading latency
- Server tick duration
- Server-side errors
As player traffic increases, the system experiences additional pressure:
- Player spikes generate more traces
- Chunk generation introduces high-cardinality attributes
- Tick metrics require aggregation trade-offs
When lag occurs, engineers expect a straightforward debugging workflow:
- Follow a trace from player login
- Observe chunk generation
- Identify delays during world persistence
Instead, they encounter:
- Missing spans for chunk generation
- Metrics without player or world context
- Logs that cannot be correlated to a specific request
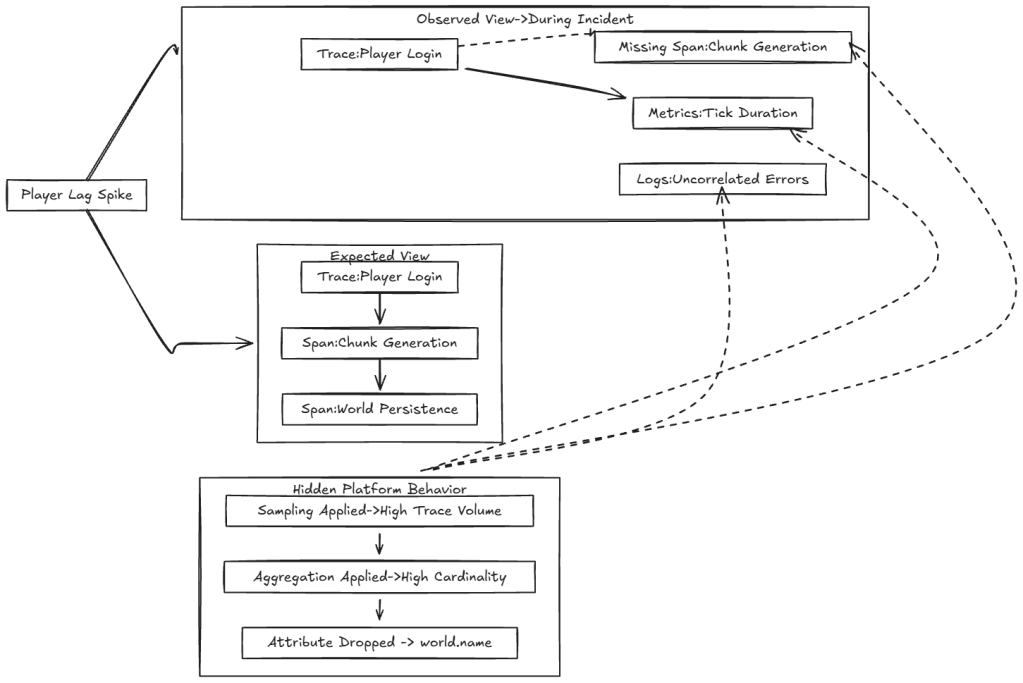
Telemetry reaches the platform, but the platform then:
- Applies head-based sampling under load
- Aggregates metrics to control cost
- Drops high-cardinality attributes such as chunk.id or world.name
- Normalizes timestamps or span identifiers
Engineers cannot determine which data exists and which data was removed. As a result, debugging the Minecraft server turns into debugging the observability platform itself.
OpenTelemetry-Compatible vs. OpenTelemetry-Native
Many platforms advertise OpenTelemetry support. The distinction between compatible and native matters more than it first appears.
OpenTelemetry-compatible platforms
- Accept OTLP data
- Convert it into proprietary schemas
- Apply sampling and aggregation without visibility
- Drop or rename attributes such as world.name or player.id
OpenTelemetry-native platforms
- Use OpenTelemetry as the core data model
- Preserve spans, metrics, and logs as emitted
- Retain semantic conventions and resource context
- Make processing decisions inspectable
If the data model changes, the engineer’s mental model breaks. Abstraction delays failure until a production incident exposes it.
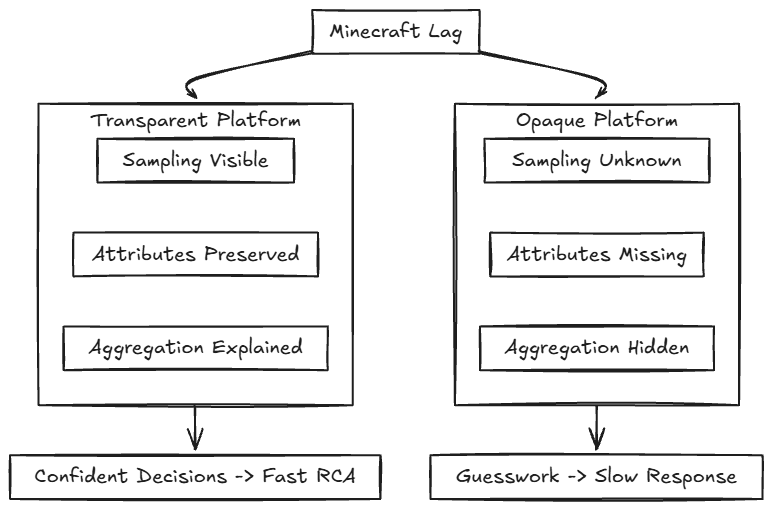
For example, during a Minecraft lag incident, engineers need fast, unambiguous answers:
- Were traces sampled?
- Were high-cardinality attributes dropped?
- Were tick metrics aggregated?
Transparency enables engineers to answer these questions quickly and confidently. Without transparency:
- On-call decisions become guesswork
- Incident response slows down
- Trust in observability erodes
Transparency does not add noise. It removes uncertainty.
With OpenTelemetry Collector
In real-world deployments, telemetry rarely flows directly from applications to storage. Most teams use the OpenTelemetry Collector as a control plane for processing, routing, and exporting signals.
OpenTelemetry Collector:
- Preserves Collector semantics
- Keeps signal transformations visible
- Avoids proprietary processing layers that obscure signal flow
This provides several operational advantages:
- Sampling policies are explicit and version-controlled
- Attribute filtering is visible and auditable
- Signal routing can change without redeploying services
- Platform teams retain control over cost and fidelity trade-offs

In the Minecraft example, engineers can determine:
- Whether chunk-related spans were sampled
- Whether player identifiers were removed intentionally
- Whether tick metrics were aggregated upstream
This removes uncertainty during incident response.
Conclusion
OpenTelemetry standardizes how telemetry is generated and transported. Observability platforms and pipelines determine whether telemetry context is preserved.
When processing behavior is hidden or context is removed, engineers lose trust in telemetry. When pipelines remain transparent and controllable, observability enables reliable debugging and faster incident resolution.

One thought on “Native OpeTelemetry”