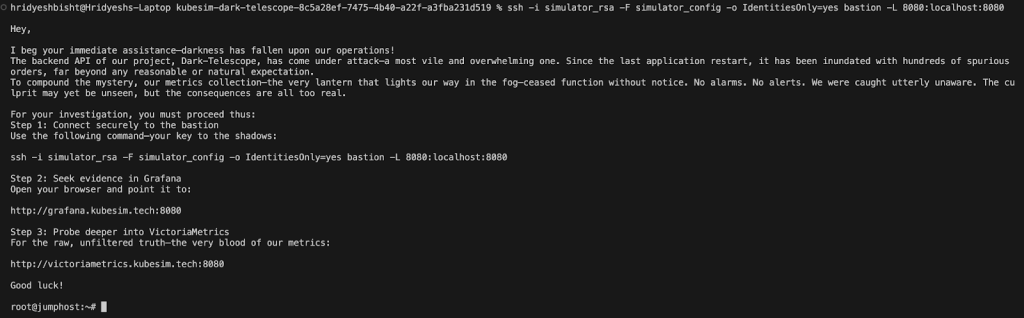
Recently, I participated in a Kubernetes Capture The Flag (CTF) challenge hosted by controlplane, and it turned out to be one of the most practical ways to learn about misconfigurations and security pitfalls in cloud-native systems.
In this blog, I’ll walk you through how I uncovered three hidden flags in a Kubernetes cluster by investigating Grafana, VictoriaMetrics, and VictoriaLogs. Each step highlights a different misconfiguration from weak secret management to metrics leaking sensitive data, to logs revealing too much detail. I’ll also highlight the security lessons learned so you know what to avoid in your own cloud native architecture.
Note: A big thank you to the controlplane team for organizing the CTF and making the learning experience so impactful.
Getting Started: Understanding Permissions
The first step in any investigation is to know what you can and cannot do. In Kubernetes, that means checking your Role-Based Access Control (RBAC) permissions.
kubectl auth can-i --list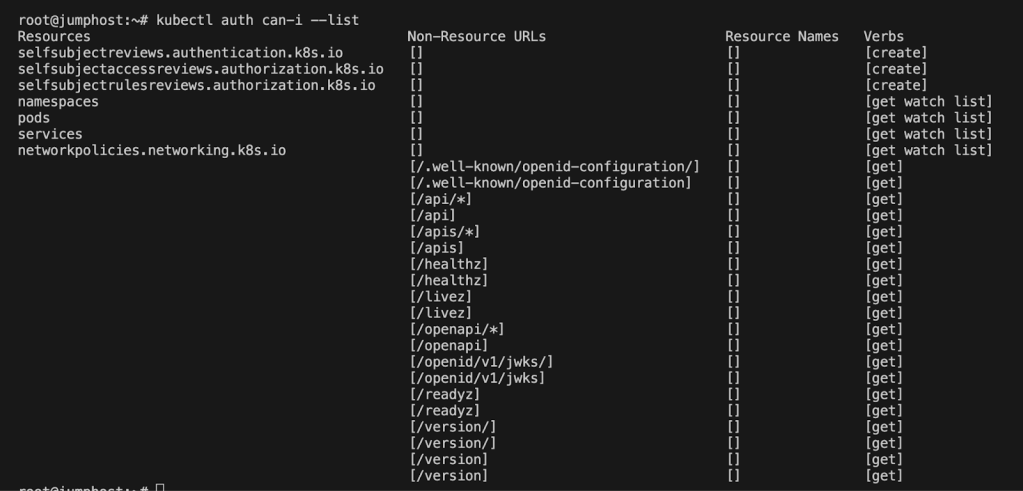
I learned I could list namespaces, pods, and services. That was enough to start exploring.
Security lesson: RBAC defines who can do what in your cluster. Even if a secret slips into the wrong place, RBAC limits the blast radius by preventing every account from reading it.
Think of RBAC as locked doors inside a building, even if someone sneaks in through the lobby, they can’t access every room without the right key.
1. Explore Grafana
My first step was to investigate Grafana, a service I had used before. Because this challenge involved logs and metrics, Grafana seemed like a natural starting point to analyze the app.
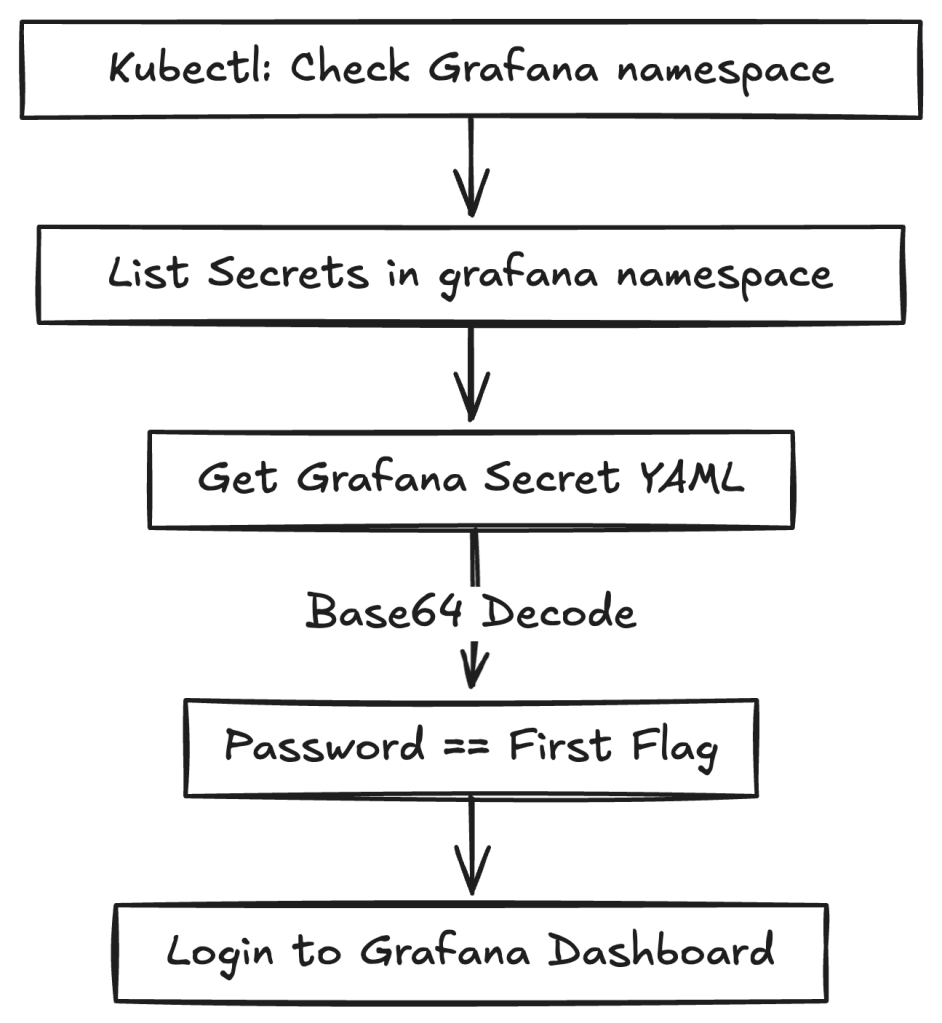
Grafana requires a username and password to log in. In Kubernetes, sensitive data such as credentials is typically stored in Secrets. To confirm whether Grafana was running and to check for secrets, I ran:
kubectl get secrets -n grafana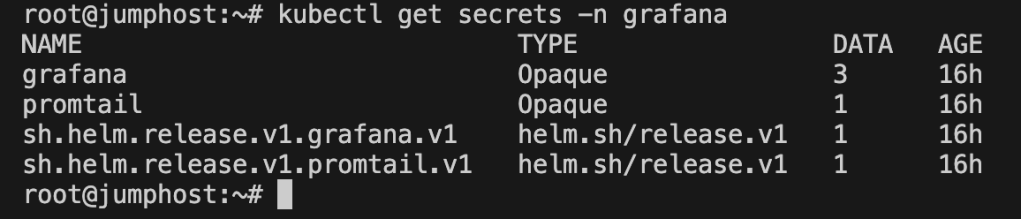
This confirmed the presence of a Grafana secret. To view its contents:
kubectl get secret grafana -n grafana -o yaml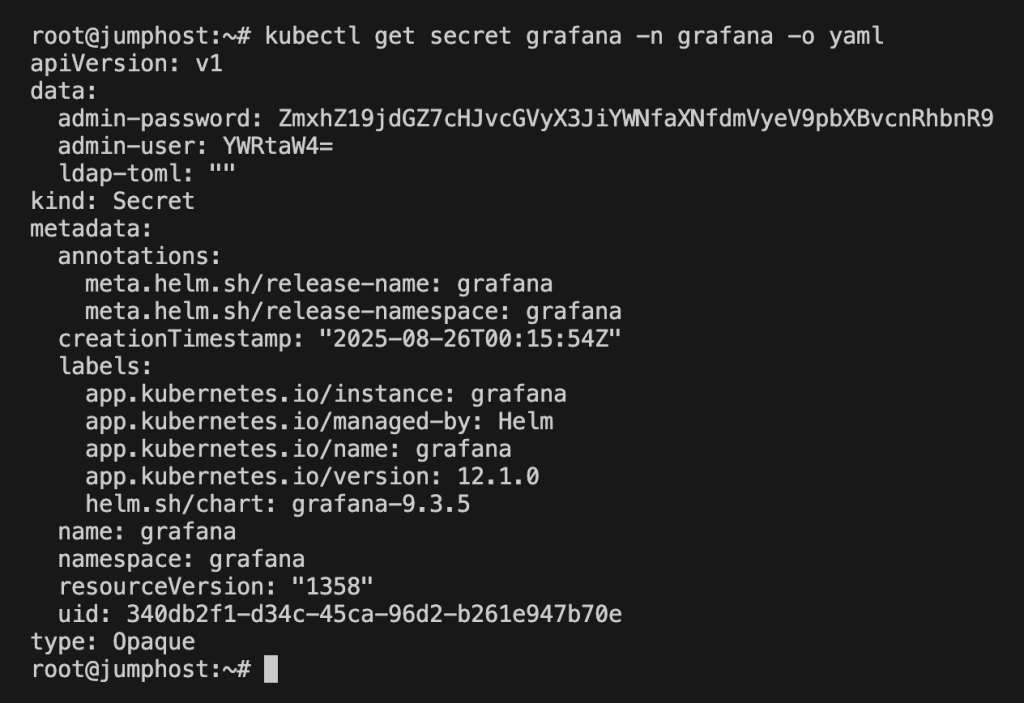
The YAML output contained base64-encoded values for admin-user and admin-password. Decoding revealed this:
echo "<admin-password>" | base64 -d
And boom, the password wasn’t just a password, it was the first flag:Flag_ctf{proper_rbac_is_very_important}
A quick summarization for finding the first flag would be
Security lesson
Kubernetes secrets aren’t encrypted by default; they’re only base64-encoded. Anyone with read access can decode them.
To avoid this issue:
- Use an external secrets manager such as AWS Secrets Manager, or GCP Secret Manager.
- Rotate credentials regularly.
- Apply RBAC carefully so that only trusted service accounts can access secrets.
Think of secrets as house keys. Don’t leave them under the doormat; store them in a safe place and hand them only to people who need them.
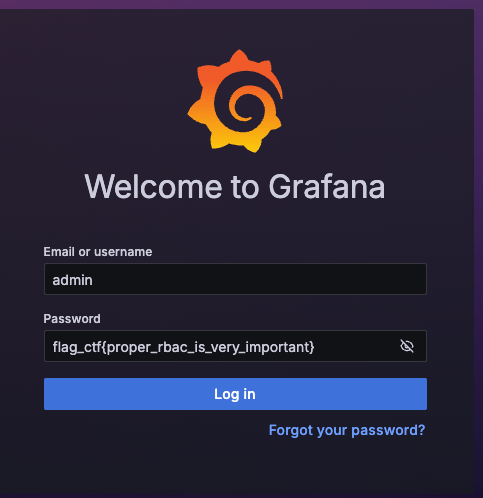
With Grafana unlocked, I could finally log in and look around. And since I’m a data-driven person, the natural next step was to explore the metrics in VictoriaMetrics, where the second flag awaited.
2. Figure out VictoriaMetrics
VictoriaMetrics is a time-series database, often used as an alternative to Prometheus. Because the CTF description mentioned “spurious orders and missing metrics,” I decided to look here next.
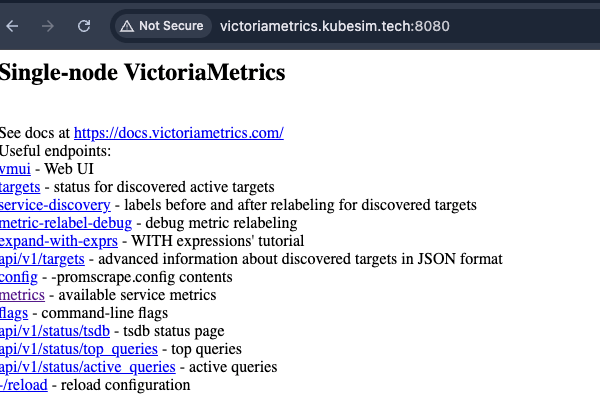
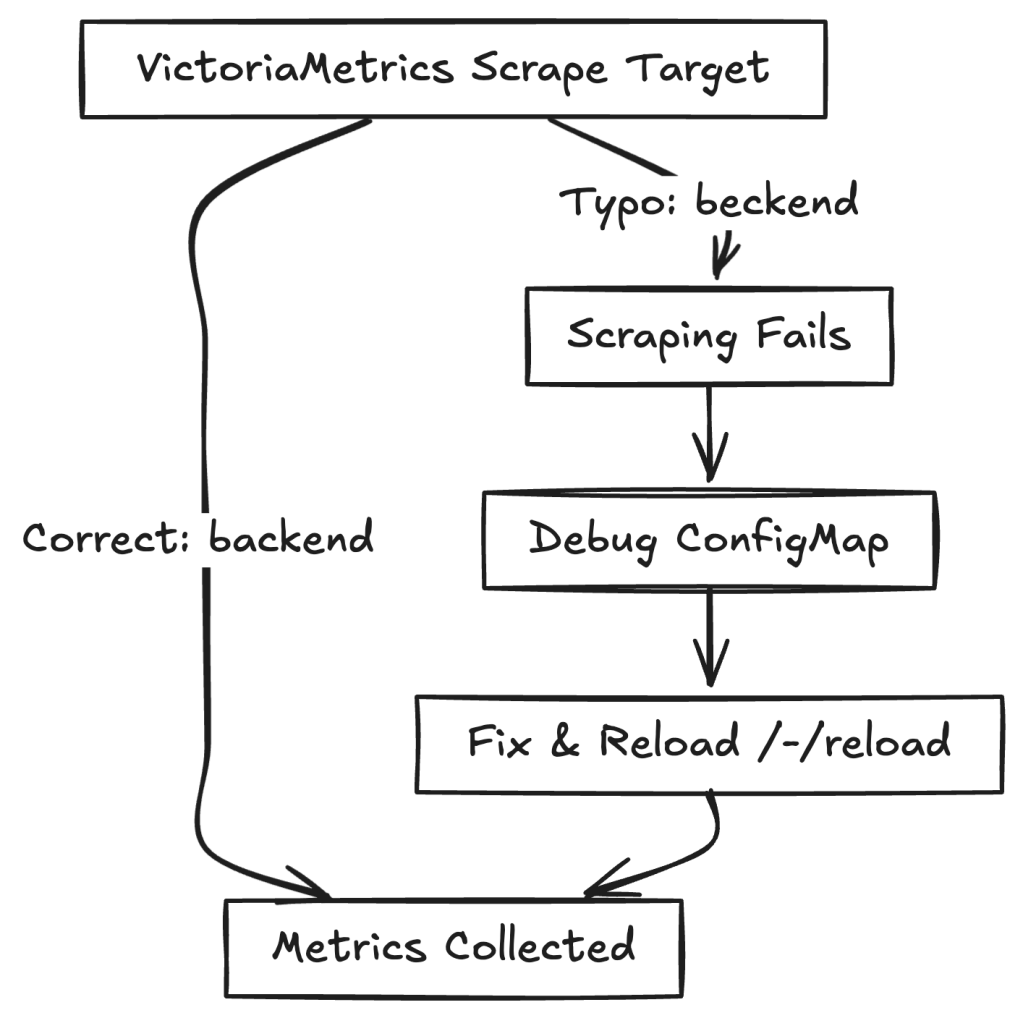
When I opened the VictoriaMetrics web UI, I ran into an error. A closer look revealed the root cause: the scrape target was misconfigured. Instead of pointing to the correct backend service, it contained a typo:
backend.beckend:3000 instead of backend.backend:3000
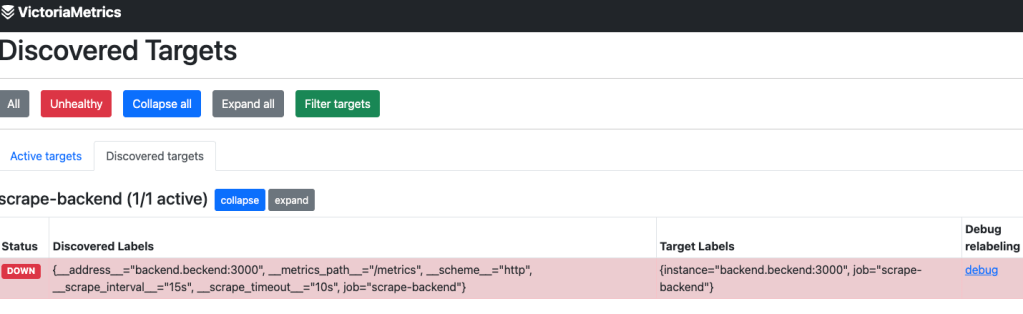
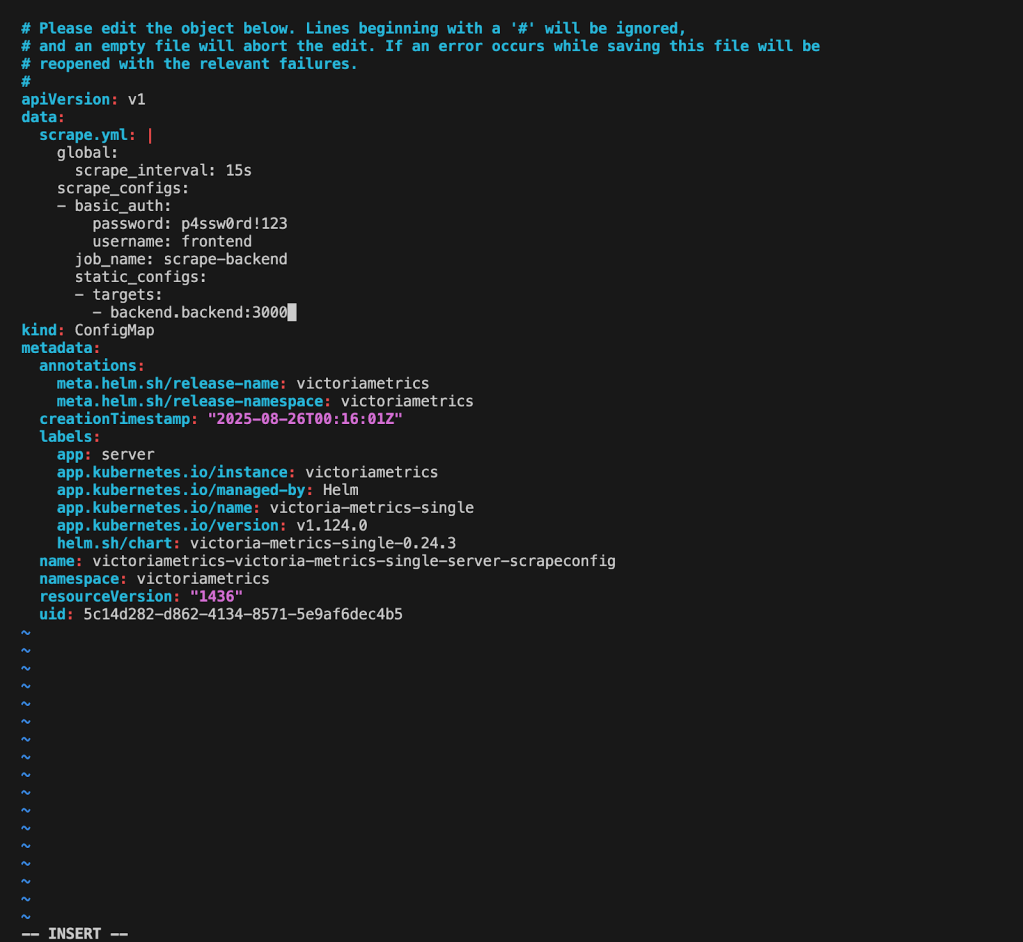
This typo stopped VictoriaMetrics from scraping backend metrics. Kubernetes stores scrape targets in ConfigMaps. Checking the ConfigMap confirmed the mistake:
kubectl get configmap -n victoriametrics
I edited the victoria-scrapeconfig ConfigMap, corrected the typo,
After fixing the scrape target and reloading VictoriaMetrics (/-/reload endpoint), which could be done using the curl command.
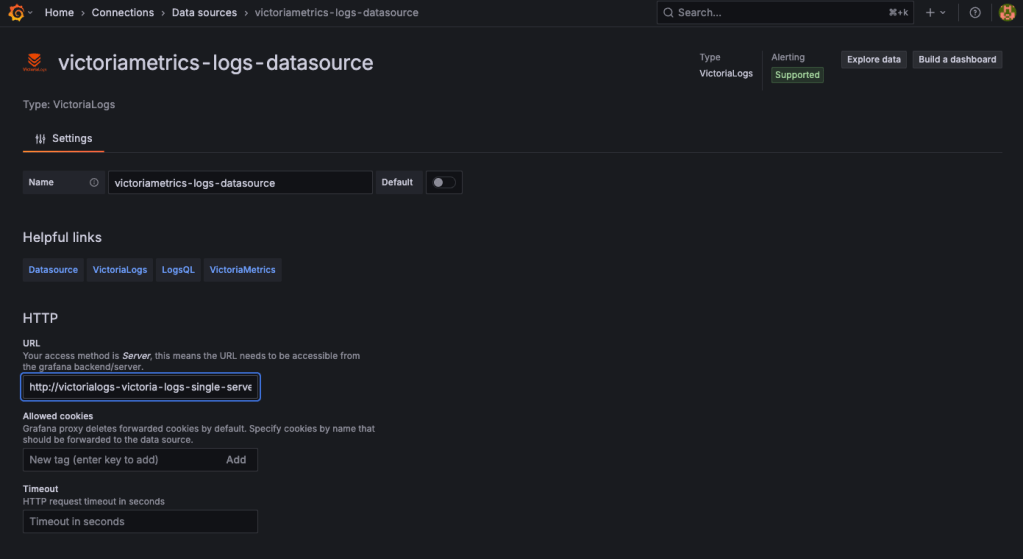
curl -X POST http://victoriametrics.kubesim.tech:8080/-/reloadNow metrics were flowing correctly again. Instead of querying VictoriaMetrics directly, I chose to integrate it into Grafana for better visualization. First, I located the service:
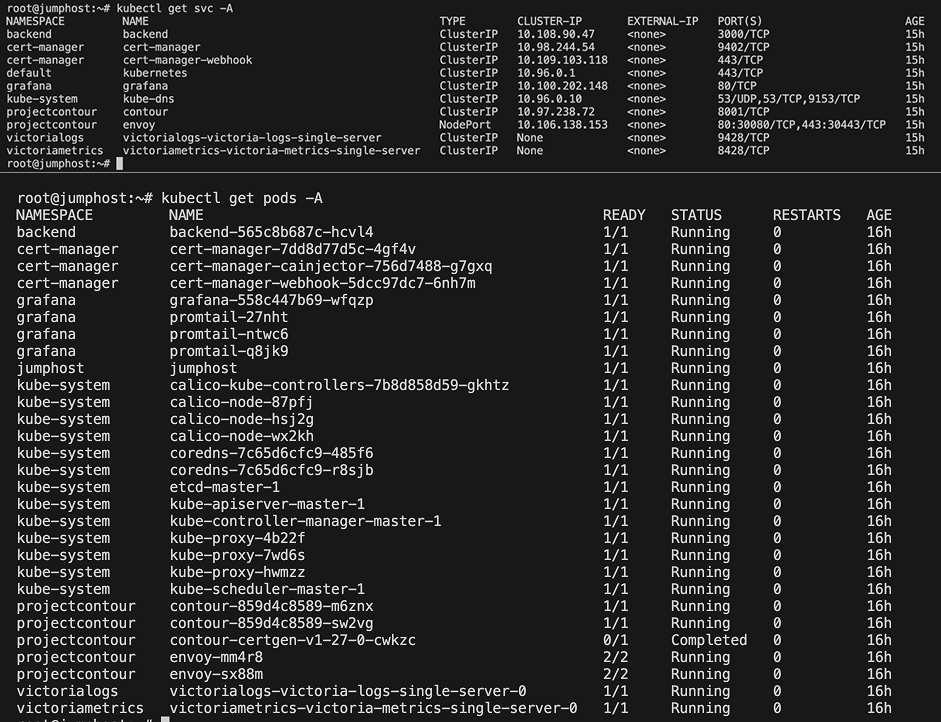
kubectl get svc -n victoriametricsThis revealed the endpoint: http://victoriametrics-victoria-metrics-single server.victoriametrics.svc.cluster.local:8428
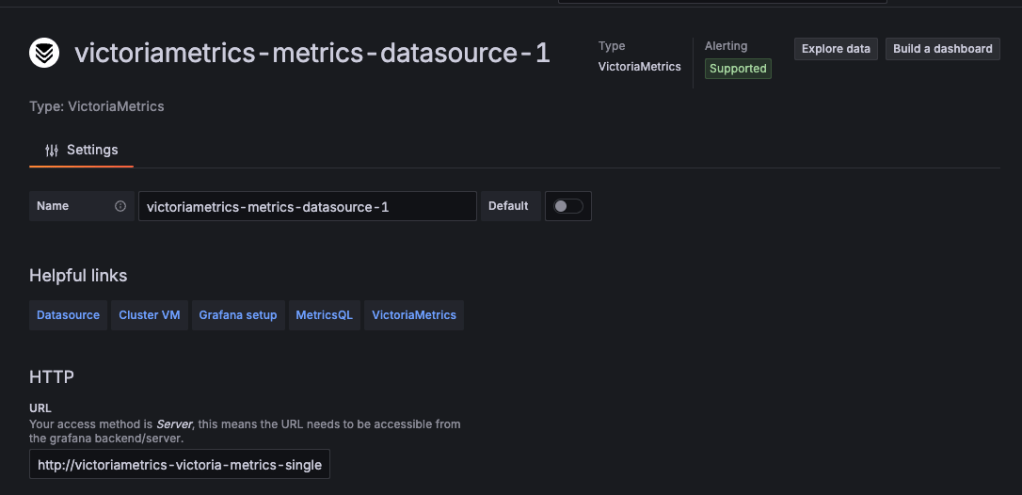
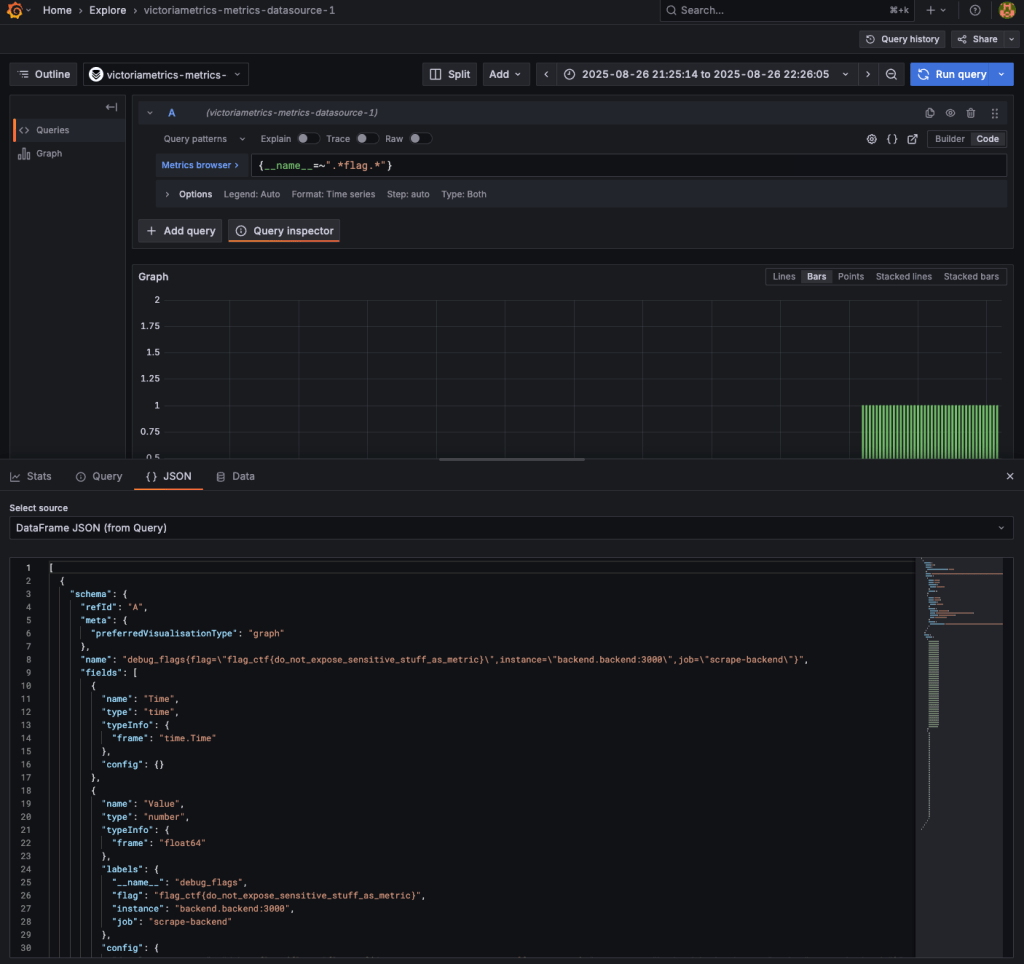
I added the endpoint as a Grafana data source and began exploring metrics. While browsing labels, I discovered sensitive data directly exposed inside a metric label:
flag_ctf{do_not_expose_sensitive_stuff_as_metric}
A quick summarization for finding the second flag would be
Security Lesson
Metrics should provide operational insight, not secrets. Sensitive values such as credentials, tokens, or flags must never be stored as metric labels or values.
Here are some better practices.
- Don’t store sensitive values (tokens, API keys, flags) in labels or values.
- Keep labels high-level (for example, method=GET, status=200).
- Audit exporters regularly to ensure they don’t leak secrets into metrics.
Note: Keep metrics high-level and generic, for example: http_requests_total{method="GET", status="200"} and not: http_requests_total{user_token="abc123secret"}
Think of metrics as your car’s dashboard. They should show fuel levels and speed, not your bank PIN.
4. VictoriaLogs and specific order
With Grafana and VictoriaMetrics explored, the final challenge was hidden deeper in VictoriaLogs and the backend API. This stage required combining clues from logs, metrics, and APIs.
I started by checking available services:
kubectl get svc -n victorialogs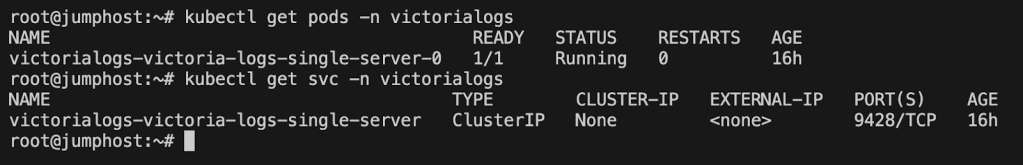
This revealed the VictoriaLogs service:
victorialogs-victoria-logs-single-server ClusterIP None 9428/TCPBecause the service was exposed only as ClusterIP, I couldn’t access it directly through a browser. RBAC restrictions also blocked port-forwarding.
Instead, I used Grafana Explore with the VictoriaLogs data source, which allowed me to query logs visually.
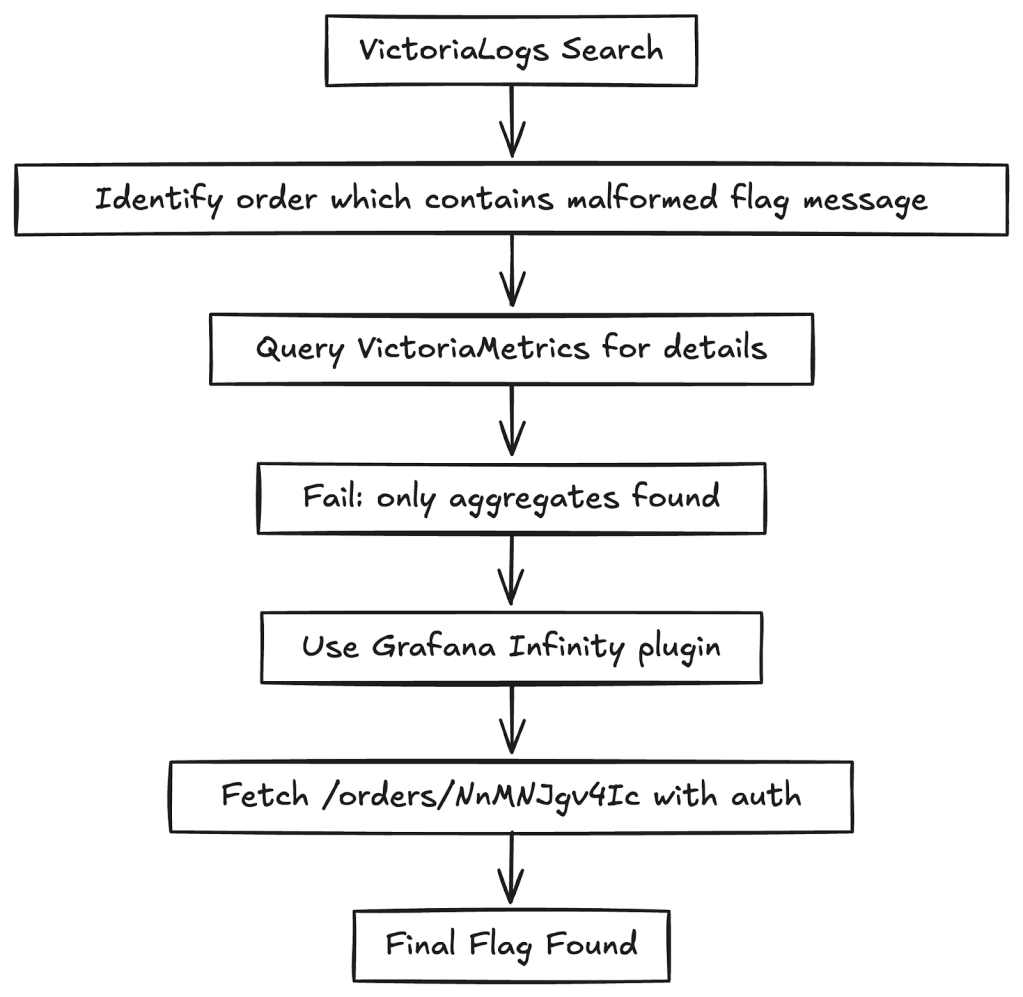
My first search for flag_ctf in VictoriaLogs returned a UID that appeared useful but turned out to be a dead end.
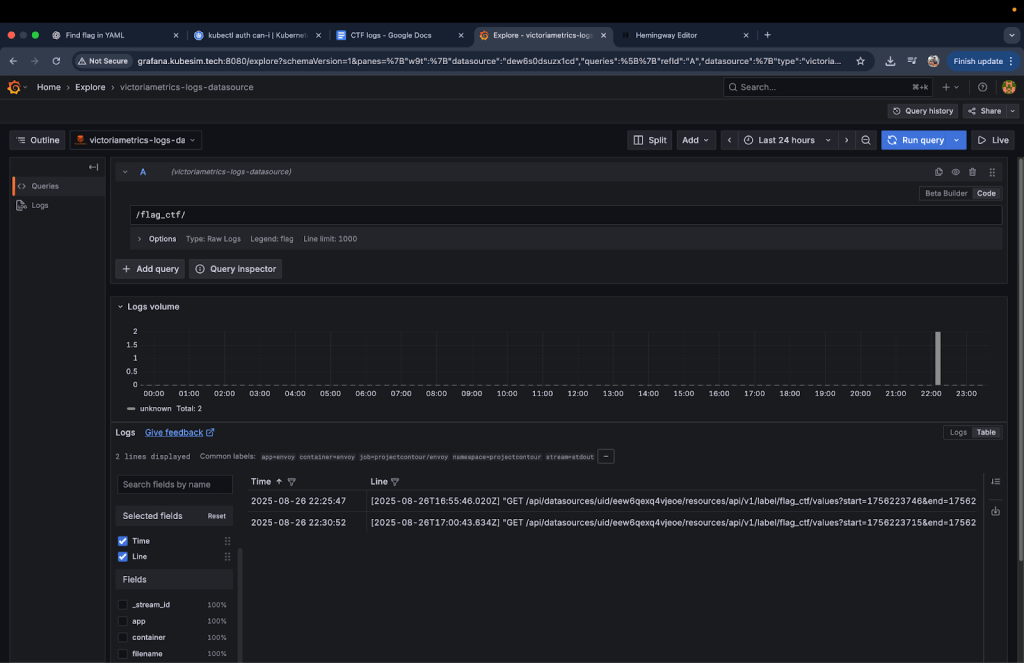
Switching strategy, I broadened my search to just flag and found the real clue:
/orders/NnMNJgv4Ic flag is malformed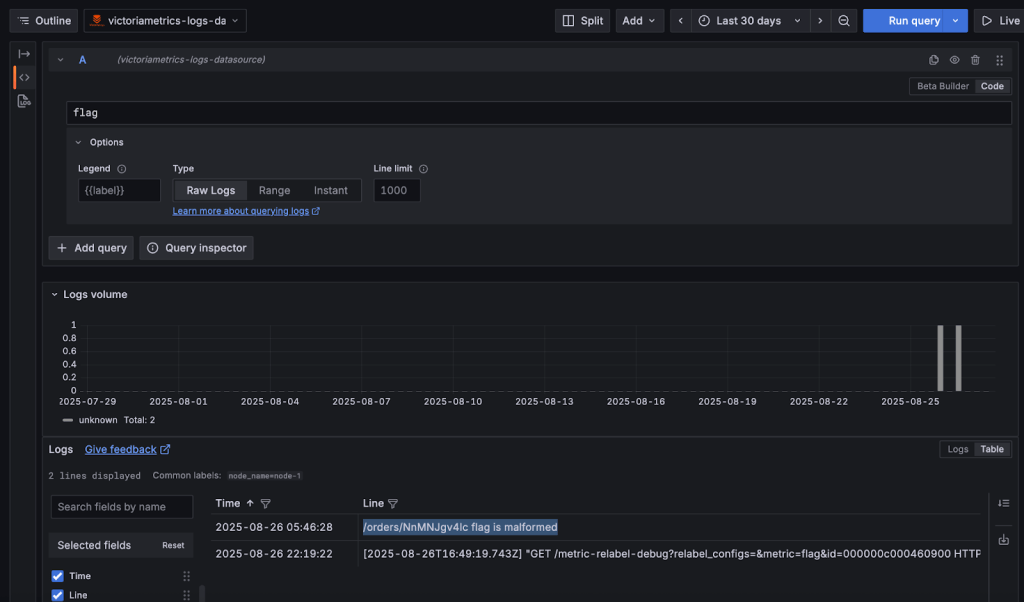
This revealed an order ID (NnMNJgv4Ic) tied to a malformed flag. My first instinct was to query VictoriaMetrics for details about the order:
{order_id="NnMNJgv4Ic"}This failed. VictoriaMetrics was only exposing aggregates (for example, total_orders=400). It didn’t store individual order-level data, hence the malformed flag wasn’t in metrics.
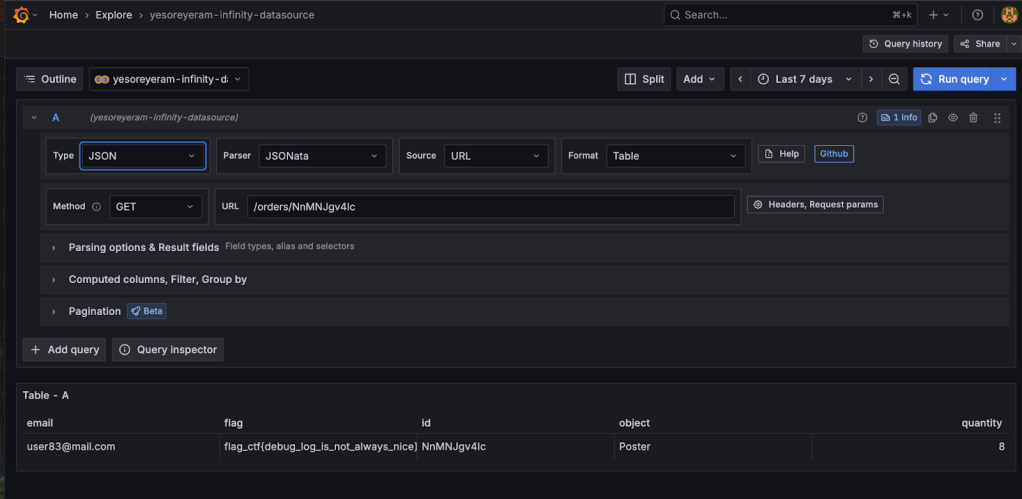
The optimum approach was to use Grafana’s Infinity plugin to query the backend API. The Infinity plugin lets you query APIs directly and fetch JSON data, bypassing PromQL’s limitations.
I configured Infinity with:
- URL: http://backend.backend:3000/orders/
- Authentication: Basic auth (frontend:p4ssw0rd!123)
Running a GET query on /orders/NnMNJgv4Ic finally returned the last flag:
flag_ctf{debug_log_is_not_always_nice}
Alternate approaches
There were two other possible methods to retrieve the order data:
ConfigMap Modification
You could edit the VictoriaMetrics scrape configuration to replace the default /metrics endpoint with /orders:
- job_name: 'backend-orders'

  static_configs:

  - targets: ['backend.backend:3000/orders']
After reloading the configuration (/-/reload endpoint), order data would appear in Grafana.
- Pros: Works with existing Grafana–VictoriaMetrics integration.
- Cons: PromQL is not designed for JSON data. Extracting meaningful values would require complex queries or converting PromQL outputs into JSON, adding overhead.
Sidecar Proxy
Another approach would be to deploy a sidecar container alongside the backend service. The sidecar could intercept requests to /metrics and proxy them to /orders. This would trick VictoriaMetrics into scraping the order data as if it were standard metrics.
- Pros: Clean separation without modifying VictoriaMetrics config.
- Cons: This approach requires deploying new workloads, which was blocked by RBAC restrictions in the CTF environment. In production, it also introduces complexity and operational overhead.
A quick summarization for finding the second flag would be
Security Lesson
Logs should record operational details such as errors, retries, or order IDs. They must never include sensitive data such as passwords, tokens, or personal information.
In production, always sanitize logs to remove identifiers or debug messages that could expose internal details.
Think of sensitive data in logs like writing your Wi-Fi password on the office whiteboard. It might be convenient once, but anyone passing by can copy it and misuse it later. Instead, logs should only store safe references such as a request ID or error code, which you can use to securely trace the issue elsewhere.
Conclusion: Key Takeaways
This Kubernetes CTF was more than just a flag hunt, it was a practical walkthrough of common cloud-native security pitfalls. Each flag revealed a different misconfiguration or security oversight that can easily occur in real-world clusters.
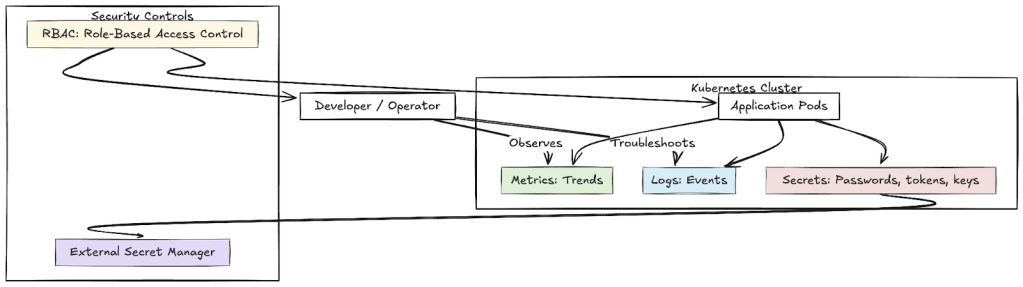
An image to summarize the entire blog post would be:
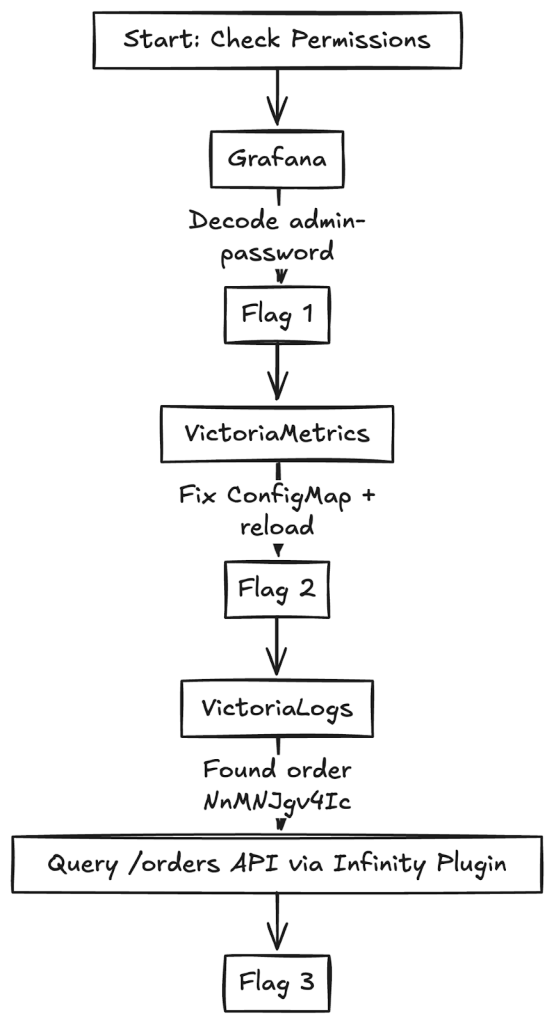
When working with Kubernetes and observability tools, it’s easy to fall into traps that seem harmless but can create serious security risks. The CTF highlighted a few of these.
- Secrets are not just another config: It’s tempting to drop passwords, tokens, or keys directly into Kubernetes manifests or ConfigMaps because “it just works.” But those files live in plain text and can be read by anyone with cluster access. In practice, this means:
- Metrics tell the story, but not the details: Metrics (like request counts, error rates, or latency) are like a dashboard in a car. They tell you what’s happening overall but not why. Putting sensitive data (like tokens or flags) into metrics is like writing your ATM PIN on the fuel gauge visible to everyone checking performance.
- Logs are for operations, not secrets: Logs should capture events like errors, retries, or order IDs. But they must never include raw sensitive data such as passwords or personal information.
- RBAC is your safety net: RBAC defines who can do what in your cluster.
An image summarizing these key points is below
For more information about supplemental topics, refer to:
- https://programmerprodigy.code.blog/2025/06/04/understanding-observability-with-opentelemetry-and-coffee/
- https://programmerprodigy.code.blog/2025/05/07/a-developers-guide-to-kubernetes-components/
Acknowledgments
The controlplane team provided an excellent primer on cloud-native security. They showed how small mistakes, such as using outdated templates, storing secrets incorrectly, or exposing sensitive data in metrics can quickly lead to real vulnerabilities.
During the live CTF, I didn’t document my steps in detail. I’m grateful that controlplane later recreated the same containerized environment, which gave me the opportunity to retrace my steps and document this blog covering the full journey of capturing the flags.
